Info
This script is a Python application that generates a horizontal bar chart representing the distribution of file types by size within a specified directory, leveraging libraries such as
os,tkinter, andmatplotlib.This script is useful for analyzing and visualizing the distribution of file types within a folder, providing insights into which types of files are taking up the most space. It’s a practical tool for disk space management and data organization tasks.
import os
import tkinter as tk
from tkinter import filedialog
import matplotlib.pyplot as plt
root = tk.Tk() # Create a temporary root window
root.withdraw() # Hide the root window
#folder_path = filedialog.askdirectory() # Prompt user to select a folder
folder_path = "C:/Users/Hecti/Downloads"
# Initialize variables to store file types and sizes
file_types = {}
total_size = 0
# Iterate through all files and folders in the directory
for root, _, files in os.walk(folder_path):
for file in files:
# Get file path and size
file_path = os.path.join(root, file)
file_size = os.path.getsize(file_path)
# Extract file extension (if any)
file_type = os.path.splitext(file)[1].lower() # Convert to lowercase
# Update file type dictionary
if file_type in file_types:
file_types[file_type] += file_size
else:
file_types[file_type] = file_size
# Update total size
total_size += file_size
# Calculate percentages for each file type
file_type_percentages = {
file_type: (size / total_size) * 100 for file_type, size in file_types.items()
}
# Filter out file types with 0.00% contribution
filtered_percentages = {file_type: percent for file_type, percent in file_type_percentages.items() if percent > 0.00}
# Sort file types by percentage in descending order
file_types_sorted = sorted(filtered_percentages.items(), key=lambda item: item[1], reverse=True)
# Create bar chart data and labels
bar_chart_labels = [f"{file_type} ({percent:.2f}%)" for file_type, percent in file_types_sorted]
bar_chart_data = [percent for _, percent in file_types_sorted]
# Create horizontal bar chart
plt.figure(figsize=(10, 6))
plt.barh(bar_chart_labels, bar_chart_data, color=['skyblue', 'lightgreen', 'gold', 'lightcoral'])
plt.xlabel("Percentage of Total Size")
plt.ylabel("File Type")
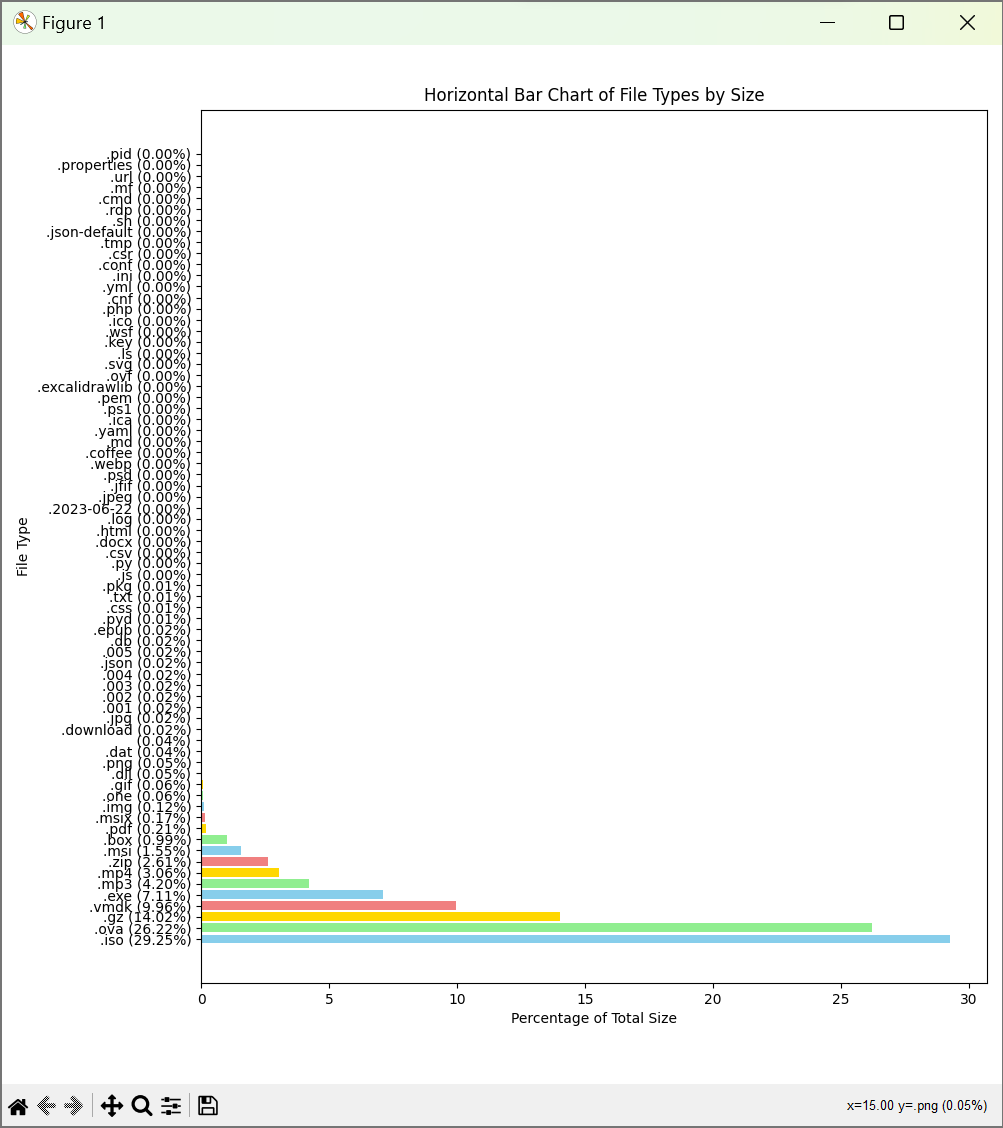
plt.title("Horizontal Bar Chart of File Types by Size")
plt.tight_layout()
plt.show()Breakdown:
GUI for Folder Selection: Utilizes
tkinterto create a graphical user interface. Although the actual folder selection dialog (filedialog.askdirectory()) is commented out in this snippet, the intention is to let users select a folder through a GUI. Instead, a hardcoded path ("C:/Users/Hecti/Downloads") is used as the directory to analyze.Directory Traversal: Walks through the specified folder and its subfolders using
os.walk(), analyzing all files encountered.File Type and Size Calculation: For each file, it calculates the file size and categorizes the file by its extension (type), updating a dictionary that tracks the cumulative size of files for each file type. It normalizes file extensions to lowercase to ensure consistency in file type categorization.
Percentage Calculation: Computes the percentage of total disk usage for each file type based on the cumulative sizes collected. It filters out file types that do not significantly contribute to the total size (i.e., those with a 0.00% contribution are excluded).
Data Preparation for Visualization: Prepares the data for a horizontal bar chart, including labels that combine the file type and its percentage of the total size, formatted to two decimal places.
Bar Chart Visualization: Generates a horizontal bar chart using
matplotlib, with file types and their percentages of the total directory size. The chart uses different colors for each bar for visual distinction and includes labels for the x-axis (“Percentage of Total Size”), y-axis (“File Type”), and a title (“Horizontal Bar Chart of File Types by Size”).Presentation: The chart is displayed in a window with a specified figure size, ensuring all elements are properly laid out and visible.