Module 3: CloudWatch Dashboard Assignment
Problem Statement: You work for XYZ Corporation. To maintain the security of the AWS account and the resources you have been asked to implement a solution that can help easily recognize and monitor the different users. Also, you will be monitoring the machines created by these users for any errors or misconfigurations.
Tasks To Be Performed:
- Create a dashboard which lets you check the CPU utilization and networking for a particular EC2 instance.
-
Preparation:
- I first ensured that I had two EC2 instances running:
instance1andinstance2.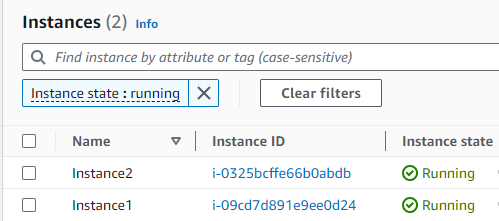
- I first ensured that I had two EC2 instances running:
-
Building My Dashboard:
- I logged into AWS and went straight to CloudWatch.
- On the left side, I clicked on
Dashboardsand then hitCreate Dashboard. - I gave my dashboard the name
EC2sand clickedCreate dashboard
-
Populating the Dashboard with Widgets:
- Inside my new dashboard I get prompted to
Add widget. - I chose the
Linewidget because it visually made the most sense for what I wanted. - Under
Metrics, I navigated toEC2 -> Per-Instance Metrics. - I selected
CPUUtilizationand then filtered by my EC2 instance’s ID or name for accuracy. - For networking, I picked metrics like
NetworkPacketsInandNetworkPacketsOut. Again, I made sure to filter by my EC2 instance.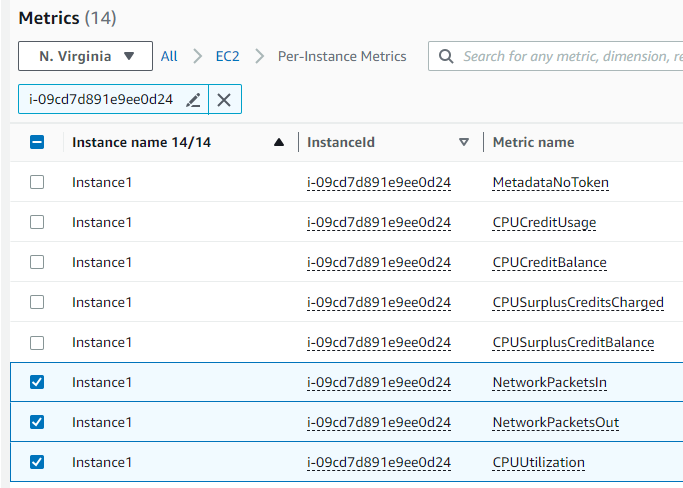 Here I picked
 Instance1will repeat steps forInstance2 - Once I added all my metrics, I clicked
Create widget. - The result is a dashboard with 2 widgets for
Instance1andInstance2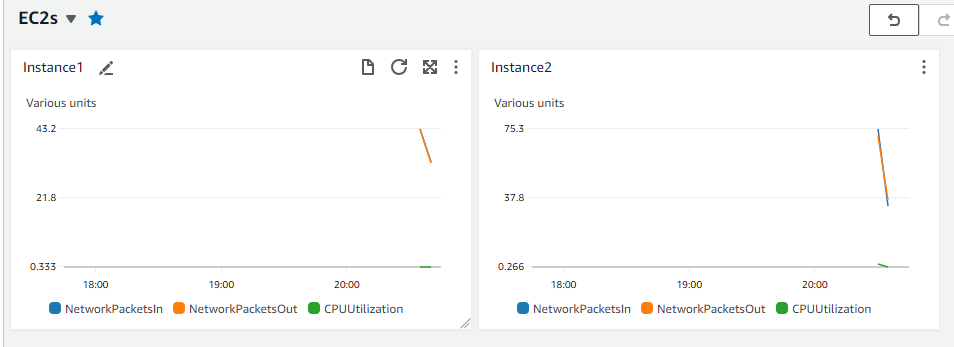
- Inside my new dashboard I get prompted to
-
Saving My Work:
- I was happy with how everything looked, so I clicked
Save dashboard.
- I was happy with how everything looked, so I clicked
-
Simulating Load on
Instance1: ^877754- To compare the metrics side-by-side, I decided to simulate some load on
instance1while leavinginstance2idle. - I SSH-ed into
instance1. - To increase CPU usage, I ran:
while true; do openssl dgst -sha256 /dev/zero; done & - To generate some network traffic, I used the
curlcommand to download a large file multiple times:while true; do curl -O https://dumps.wikimedia.org/enwiki/latest/enwiki-latest-pages-articles.xml.bz2; done & - This step ensured that
instance1was now actively using CPU and network resources, whileinstance2remained idle.
- To compare the metrics side-by-side, I decided to simulate some load on
-
Results from CloudWatch Metrics: After initiating the CPU-intensive task on
instance1NetworkPacketsIn:
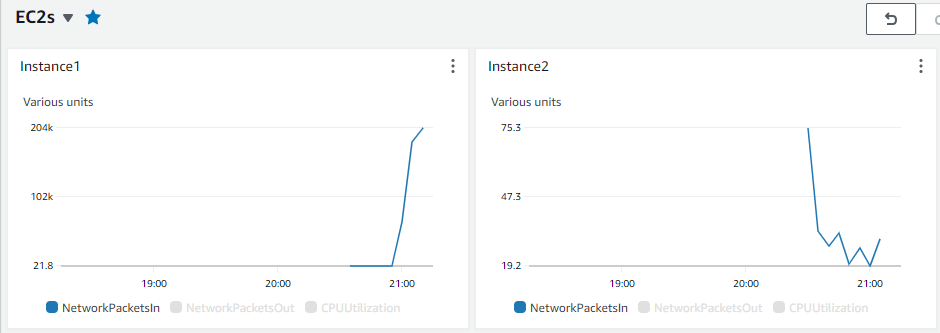
Instance1showcased heightened incoming packets due to the network tasks.CPUUtilization:
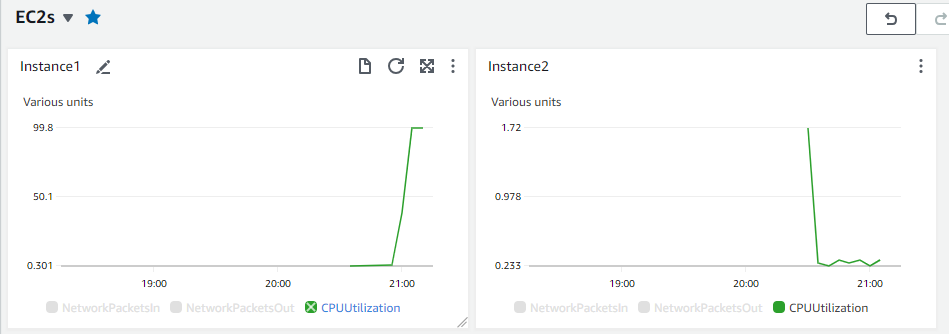 High CPU usage was evident on
 Instance1from the hashing operation.